In this workshop, you will learn the basics of the statistical programming environment R. This is a course for beginners, so you do not need to be fluent in any other programming language or statistical software.
We will start from scratch and learn how to set up a working R environment, including package management and related housekeeping tasks. Once you have installed R on your computer, we will dive into its basic data types and learn how they can represent common data structures. We will then discuss importing data from various file formats. Once our data is available in R, we will compute descriptive statistics and create useful plots – two essential steps in any data analysis pipeline.
Due to time constraints, we will not be able to cover more advanced topics in this course, but you will have a good understanding of the foundations of R. This knowledge will enable you to study more specific topics on your own. Specifically, we will not cover a lot of statistical topics, but I will point out some resources for additional reading. We will not cover advanced programming concepts in R either. In fact, we won’t even discuss simple programming structures such as loops or functions, because these won’t be useful until much later on (and frankly, you can do some pretty advanced data analysis in R without ever writing a single loop or function).
With all that out of the way, let’s get started!
Overview
R is a programming environment for data analysis and statistics. Here are some key facts about R (some of which reflect my personal opinion):
R is open source (which means not only free as in beer, but also free as in speech).
R is cross-platform (it runs on Windows, macOS, and Linux).
R is extremely popular for data analysis and statistics applications.
R is relatively easy to learn (at least the basics).
R has first-class vectors, matrices, tables, and lists.
A large number of third-party packages provide a wide array of additional functionality.
R encourages reproducible research.
R includes helpful documentation.
The R community is helpful, friendly, and inclusive.
We interact with R by typing text commands or running scripts in the so-called R console. This means that performing data analysis does not involve an interactive graphical user interface, where we typically perform most actions with the mouse. At first, this may sound a bit old-fashioned, but this is really one of the best features of R. In fact, writing R commands (and saving them in a script) makes the whole data analysis pipeline reproducible and reusable.
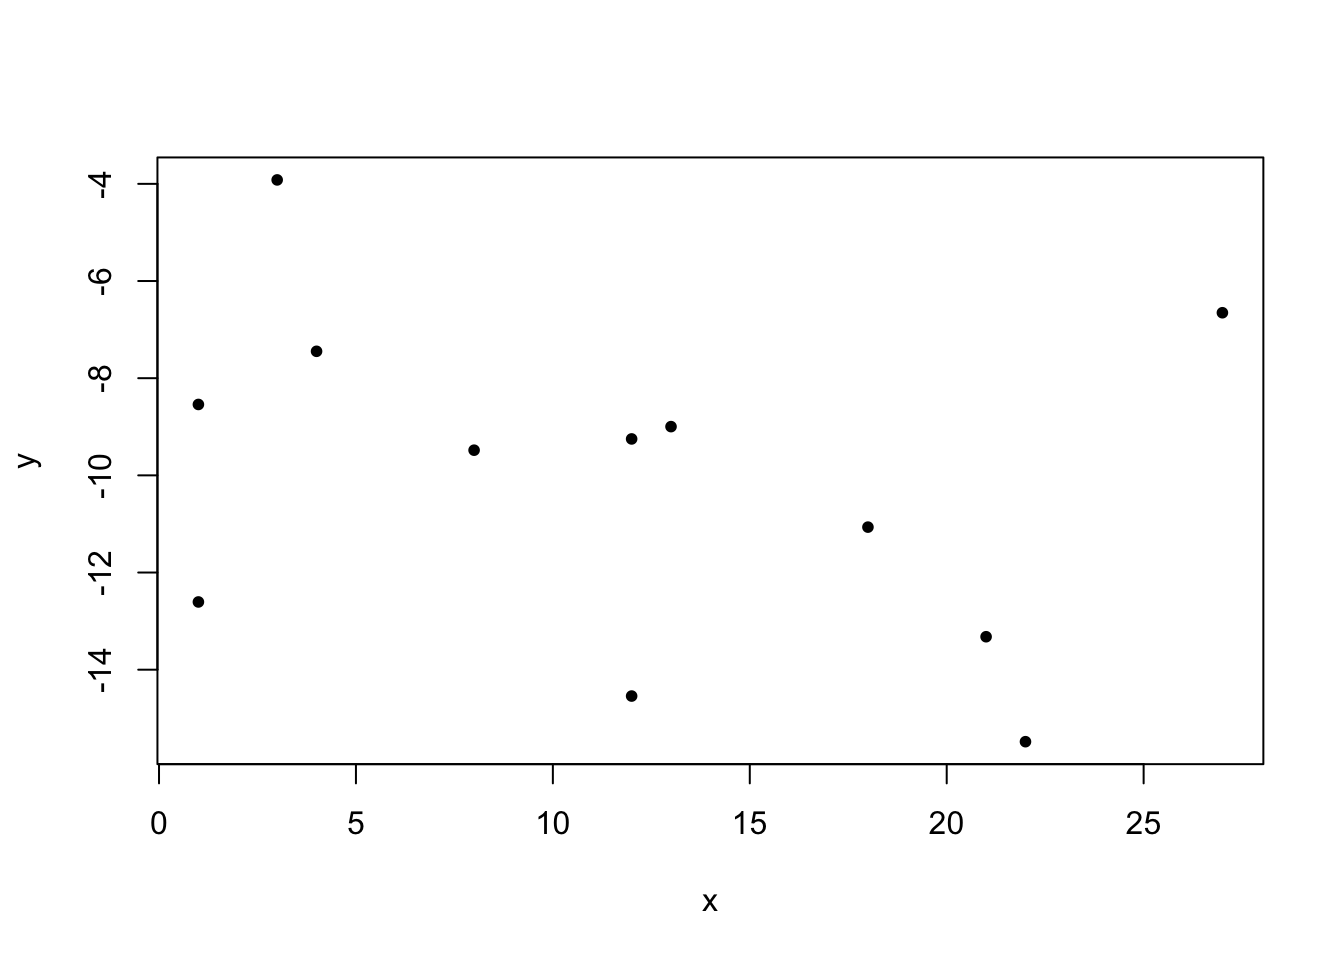
So far, we have talked about R without seeing what the language actually looks like. Here’s a sneak peak at what you will be able to understand after completing this course (gray boxes contain R commands, and white boxes show corresponding results returned by R):
set.seed(1)y =-0.1* x +rnorm(12, mean=-10, sd=4)cor.test(x, y)
    Pearson's product-moment correlation

data:  x and y
t = -1.0611, df = 10, p-value = 0.3136
alternative hypothesis: true correlation is not equal to 0
95 percent confidence interval:
 -0.7543040  0.3129176
sample estimates:
       cor
-0.3181118
plot(x, y, pch=20)
Installation
The official R website is a great resource for everything related to R. In particular, you can download an R installer for your platform of choice (“Download” – “CRAN” at the top of the left column). The actual download is hidden beneath a cascade of links, but eventually you will arrive at the installer for the selected platform. Download and install it (leave all settings at their defaults), and after a couple of seconds you have a working R installation on your computer. Note that it is usually a good idea to always use the latest version of R (4.5.2 at the time of writing this document), so you might want to check the R website for updates once in a while.
R is modular and consists of a core programming language and an optional basic integrated development environment (IDE). Although this IDE is perfectly fine, most people prefer a more powerful alternative called RStudio. Therefore, after installing R, you should head to the RStudio website and download and install the latest RStudio version (2025.09.2 at the time of writing).
First steps
Let’s start using R. We will use RStudio in this course, so open the start menu (on Windows) or use Spotlight (on macOS) to fire up RStudio. We will take a brief tour of the RStudio main window soon, but for now we’ll just use the left part of the window called Console. That’s where we enter R commands, and R will evaluate anything we enter here (this is also called the REPL, short for read–eval–print loop).
Basic arithmetic
Note the > character in the console – this is the so-called prompt, which prompts us to enter an R command (and confirm with Enter). Let’s try and see if R can do basic arithmetic (addition, subtraction, multiplication, division):
13+7
[1] 20
1001-93
[1] 908
81*76
[1] 6156
1563/43
[1] 36.34884
This looks promising, except maybe for the fact that R prepends all output with [1] – we will explain this behavior later when we introduce vectors.
Note
You don’t have to type the whitespace around the operators, so 13+7 is also perfectly fine. However, it is usually a good idea to add spaces and write 13 + 7, because it greatly improves readability.
More advanced operations
R can also compute the result of integer division and its remainder:
1563%/%43
[1] 36
1563%%43
[1] 15
Exponentiation (raising one number to the power of another) works with the ** or ^ operators:
16**2
[1] 256
16^2
[1] 256
Computing the square root is also possible:
sqrt(144)
[1] 12
R has built-in mathematical constants such as \(\pi\) and Euler’s number \(e\):
pi
[1] 3.141593
exp(1)
[1] 2.718282
Order of operations
R knows the correct order of operations and is able to deal with parentheses (PEMDAS):
(13+6) *8-12**2/ (2.5+1.6)
[1] 116.878
Note that R accepts only regular parentheses (and not square or curly brackets), so nested expressions look like this:
((13+6) *8) / (12/ (2.5+1.6))
[1] 51.93333
Note
Bear in mind that decimal numbers use a point as a decimal separator and not a comma, even if you are using German as your primary computer language!
Exercises
Install the latest versions of R and RStudio on your computer. Once everything is installed, start RStudio and find out how to display the R and RStudio version numbers.
Compute the result of 4 divided by 0.4. In addition, compute the integer result and the remainder.
Assume you have measured the values 11, 27, 15, 10, 33, 18, 25, 22, 39, and 11. Calculate the arithmetic mean using only basic arithmetic operations in a single line of code.
Evaluate the following mathematical expression (with one line of code):